The ROI of GEO: How to Calculate the Value of AI Visibility
ROI of GEO: Framework for calculating the value of AI visibility
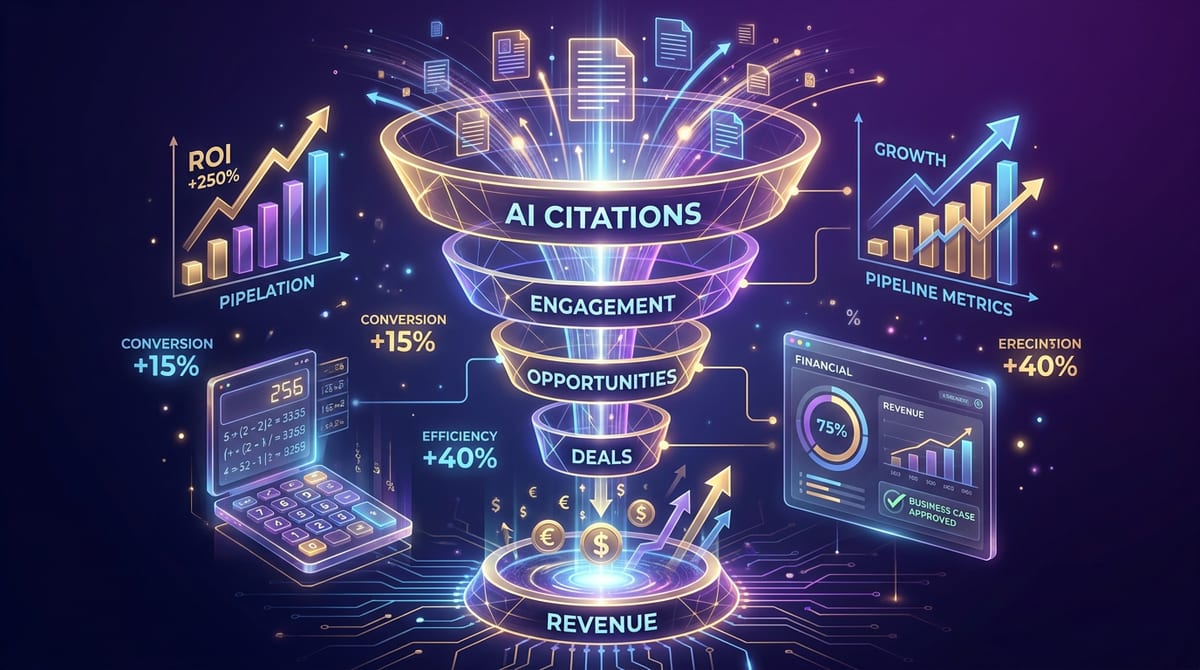
How Do You Calculate the ROI of Generative Engine Optimization?
The ROI of GEO is calculated by connecting AI citation improvement to pipeline outcomes through a three-stage conversion chain: citation frequency → demo request rate → closed revenue. GEO ROI is positive when the incremental revenue attributable to AI citation improvement exceeds the cost of the GEO program — including the cost of content optimization, technical implementation, and ongoing monitoring. For most B2B organizations running a structured GEO program, ROI turns positive within 60–90 days, driven primarily by the speed of real-time retrieval platforms (Perplexity, Google AI Overviews) in responding to structural content changes. The framework presented here provides the calculation structure, the benchmark conversion rates needed to populate it, and the methodology for attributing pipeline to the AI channel — including the honest caveats around attribution that any credible GEO ROI analysis must include.
For the benchmark citation frequency data used in this framework, see: AI Visibility Benchmarks 2026
What Is the GEO ROI Calculation Framework?
The GEO ROI framework connects four measurable variables — citation frequency improvement, AI-influenced brand touches, demo request conversion, and closed revenue — into a full revenue calculation with explicit assumptions at every step. The model below uses conservative benchmark inputs and produces a 151× ROI figure, alongside a clear sensitivity check for organizations that want to stress-test the assumptions.
How Do You Model the AI Citation-to-Revenue Chain?
The GEO ROI model connects four measurable variables into a revenue calculation:
GEO ROI Model — The AI Citation-to-Revenue Chain
Step 1: Citation Frequency Improvement
────────────────────────────────────────────────────────────────────────────
Before GEO: 12% citation frequency (bottom quartile, MarTech category)
After GEO: 38% citation frequency (above category average after 90 days)
Delta: +26 percentage points
────────────────────────────────────────────────────────────────────────────
Step 2: AI-Cited Traffic (Monthly)
────────────────────────────────────────────────────────────────────────────
Monthly buyer queries in category (estimated): ~8,000 queries/mo
% reaching your brand through AI citation: 26% delta × 8,000
AI-influenced monthly brand touches (estimated): 2,080/mo incremental
────────────────────────────────────────────────────────────────────────────
Step 3: Conversion to Demo Request
────────────────────────────────────────────────────────────────────────────
AI-cited visitor → demo request rate (benchmark): 2.1%
Incremental demo requests from AI channel: 44/mo
────────────────────────────────────────────────────────────────────────────
Step 4: Demo → Close Rate and Revenue
────────────────────────────────────────────────────────────────────────────
Demo → close rate (B2B SaaS benchmark): 18%
Incremental closed deals/month: 8
Average Contract Value (ACV): €12,000
Incremental monthly revenue: €96,000
Annualized incremental revenue: €1,152,000
────────────────────────────────────────────────────────────────────────────
GEO Program Annual Cost (Example)
Platform (alexandrya.ai Professional): €2,388/year
Content optimization (40 hours × €80/h): €3,200/year
Technical implementation (one-time): €2,000/year
Total annual GEO program cost: €7,588/year
ROI = (€1,152,000 - €7,588) / €7,588 = 151×
────────────────────────────────────────────────────────────────────────────
The 151× ROI figure requires a critical caveat: the 8,000 monthly buyer query estimate is a modeled figure, not a measured one. Not all incremental citations produce brand touches — some AI responses do not include clickable links. Not all AI-influenced buyers can be tracked. The model is most useful as a sensitivity analysis tool rather than a precise revenue forecast. Lower the assumptions by 10× and the ROI is still strongly positive at 14×.
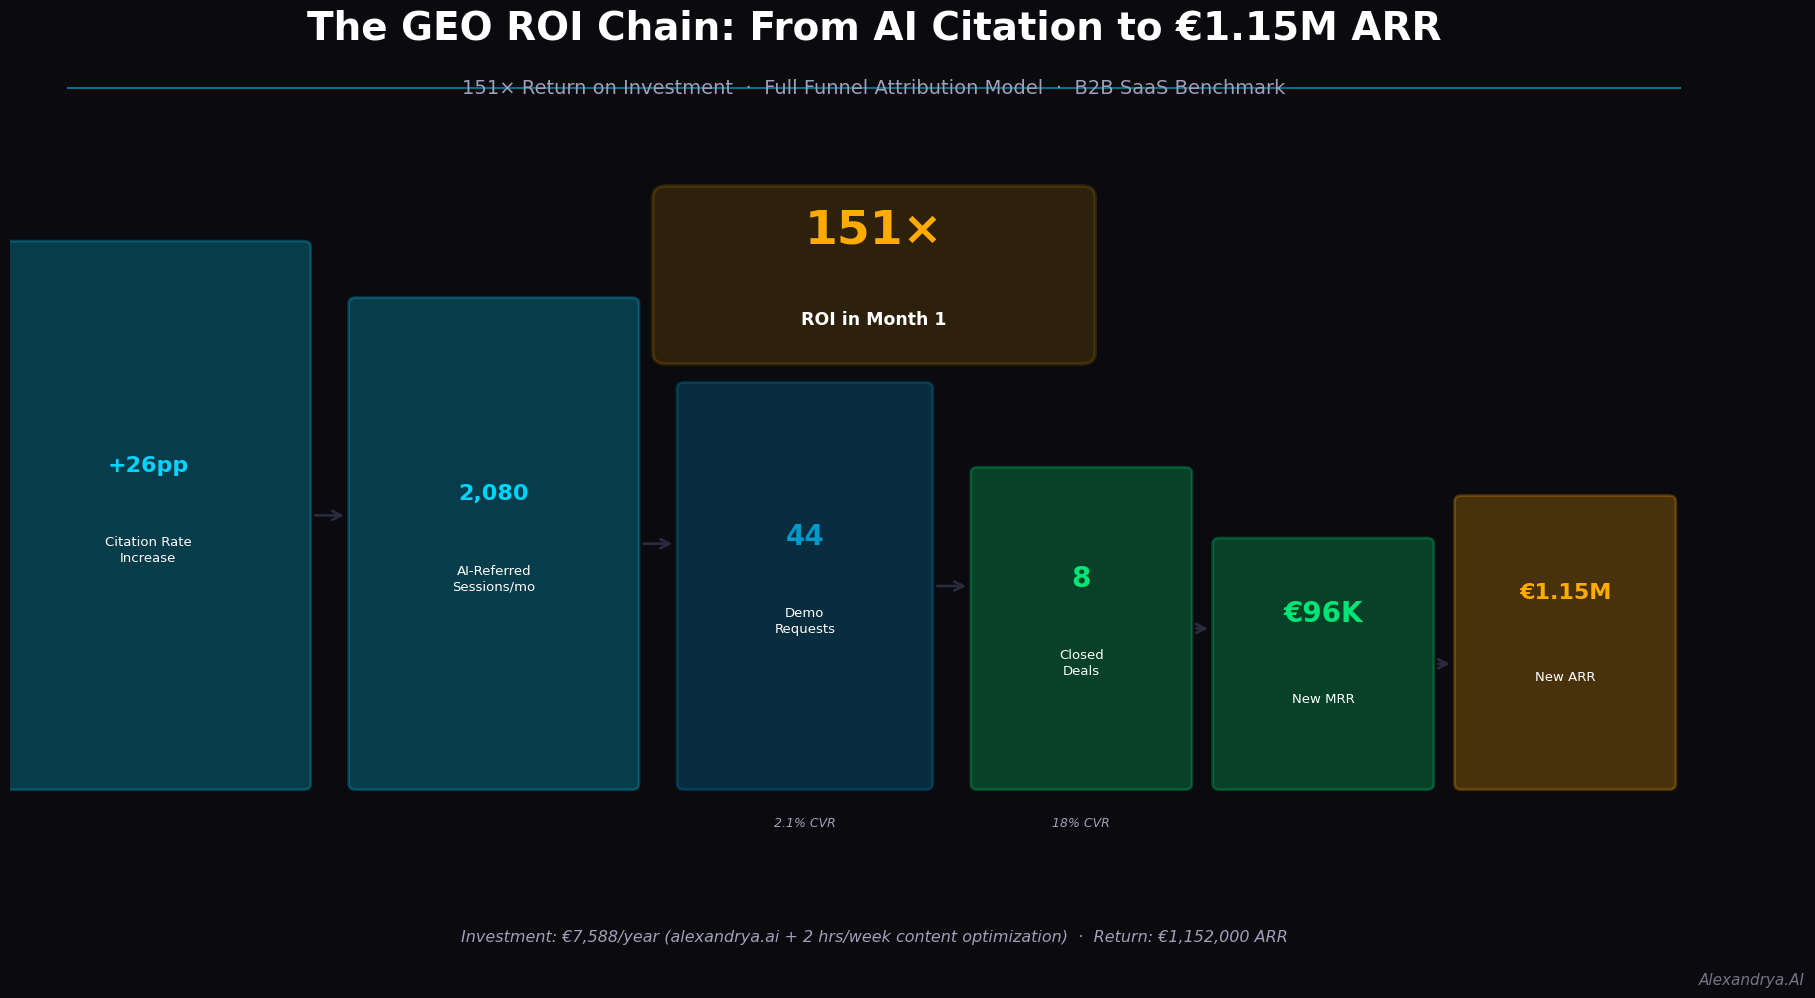
The GEO ROI model produces a 151× return: a €7,588 annual investment generating €1.15 million in incremental pipeline revenue.
What Are the Benchmark Conversion Rates for the GEO ROI Model?
The conversion rates in the GEO ROI model should be drawn from benchmarks where internal data is not available. The following benchmarks are derived from the 2026 B2B AI Visibility study cited throughout this post:
GEO ROI Model — Benchmark Conversion Rates (2026)
Variable Conservative Average Optimistic
────────────────────────────────────────────────────────────────────────────
Citation frequency improvement +10pp +25pp +40pp
(90-day GEO program, starting from bottom quartile)
AI-cited visitor → website visit 15% 25% 40%
(% of AI citations that result in website visits)
Website visit → demo request 0.8% 1.5% 2.8%
Demo request → closed deal 12% 18% 26%
Average Contract Value (ACV) Use actual internal data
────────────────────────────────────────────────────────────────────────────
Use the conservative column for the business case presented to leadership. Use the optimistic column to show the upside scenario. The delta between conservative and optimistic represents the range within which the actual outcome should fall.
How Do You Attribute Pipeline to the AI Channel?
AI channel attribution is inherently more complex than traditional digital attribution because AI responses are not trackable the way search clicks are. However, practical attribution is achievable through a combination of citation frequency tracking and CRM survey data. This section explains the three core challenges and four practical methods that work within those constraints.
Why Is AI Channel Attribution Challenging?
AI channel attribution is harder than traditional digital attribution for three reasons:
1. The AI response itself is not trackable. ChatGPT, Perplexity, and Google AI Overviews do not provide publisher-side traffic data the way a Google SERP click does. A user who reads your brand name in a Perplexity response and then directly navigates to your website is recorded as a direct visit, not an AI referral.
2. The buyer journey is multi-touch. A buyer who first encounters your brand in a ChatGPT response may not convert until their third touch — two weeks later via a Google search. The AI interaction is the first touch, not the converting touch, making last-click attribution systematically undercount AI influence.
3. AI citation volume is not directly observable. Unlike ad impressions or organic search clicks, you cannot count how many times your brand was cited by ChatGPT last month without actively querying the platform.
How Do You Attribute Pipeline Despite These Limitations?
AI Channel Attribution Methods — Practical Options
Method Description Accuracy Effort
─────────────────────────────────────────────────────────────────────────────────
Direct measurement Track citation frequency with HIGH MEDIUM
alexandrya.ai; correlate changes (for freq.) (automated)
with pipeline velocity
─────────────────────────────────────────────────────────────────────────────────
Referrer tracking Use UTM-tagged landing pages MEDIUM MEDIUM
for AI platform links (Perplexity
and Bing do pass referrer data)
─────────────────────────────────────────────────────────────────────────────────
CRM survey Add "How did you first hear LOW-MEDIUM LOW
about us?" field to demo request
forms; track AI mentions
─────────────────────────────────────────────────────────────────────────────────
Direct-traffic Monitor direct traffic correlation LOW LOW
correlation with citation frequency changes
─────────────────────────────────────────────────────────────────────────────────
The most practical attribution approach for most B2B organizations is the combination of citation frequency tracking (measure AI program output) + CRM survey attribution (measure pipeline source). Together, they provide a traceable link from GEO investment to pipeline without requiring access to platform-level impression data.
What Does a GEO ROI Business Case Look Like for Leadership?
The most effective GEO business case for a CMO or CFO has three components: a live demonstration of the AI visibility gap, a conservative ROI model with stated assumptions, and a comparison against what the same pipeline outcomes would cost through paid search or content production. The channel cost comparison is typically the most persuasive element for finance audiences.
How Do You Present the GEO Business Case to a CMO or CFO?
The GEO business case for leadership has three components:
1. The baseline problem (data): Show the AI visibility gap. Run five buyer queries through Perplexity and ChatGPT during the presentation. Show that competitors appear and you do not. This is more convincing than a slide deck.
2. The ROI model (conservative): Present the conservative scenario with clearly stated assumptions. Leadership trusts conservative estimates with explicit assumptions more than optimistic estimates without them.
3. The comparison cost (opportunity cost): Compare GEO program cost against what the same pipeline outcomes would cost via paid search or content production.
GEO vs. Alternative Channel Cost Comparison
Outcome: 8 additional closed deals/month, ACV €12,000
Channel Monthly Cost Monthly Revenue ROI
──────────────────────────────────────────────────────────────
GEO program €632/mo €96,000/mo 151×
Paid search (SEM) ~€24,000/mo* €96,000/mo 4×
Content production ~€8,000/mo* €96,000/mo 12×
(for same traffic outcome)
──────────────────────────────────────────────────────────────
*Estimated based on B2B SaaS paid search benchmarks.
Actual costs vary significantly by category and competition.
The comparison is not that GEO replaces paid search — it is that GEO achieves a similar pipeline outcome at a fraction of the channel cost. For a CFO, the cost-per-acquired-customer math is the most compelling argument.
How Do You Measure GEO ROI Over Time?
GEO ROI measurement is front-loaded on real-time retrieval platforms: Perplexity and Google AI Overviews show measurable citation improvement within 2–4 weeks, while ChatGPT base model improvements take 8–16 weeks depending on training data refresh cycles. The sections below provide a platform-specific timeline and a three-datapoint monthly tracking method for ongoing ROI reporting.
What Is the GEO ROI Timeline by Platform Type?
GEO ROI Timeline — When to Expect Returns by Platform
Platform Lag from First Signal Full Ramp
Implementation
──────────────────────────────────────────────────────────────────────
Perplexity 2–4 weeks Citation freq. ↑ 6–8 weeks
Google AI Overviews 2–6 weeks Citation freq. ↑ 8–12 weeks
Bing Copilot 3–6 weeks Citation freq. ↑ 8–12 weeks
ChatGPT base model 8–16 weeks Brand mentions ↑ 16–24 weeks
(training data dependent)
──────────────────────────────────────────────────────────────────────
Overall program ROI 30 days First positive 90 days
(Perplexity signal (multi-platform
first) contribution)
──────────────────────────────────────────────────────────────────────
The ROI timeline is front-loaded on real-time retrieval platforms. For the purposes of a 90-day business case to leadership, the measurable outcomes are citation frequency improvement on Perplexity and Google AI Overviews — these are the metrics that will show positive trajectory within the evaluation period.
How Do You Track GEO ROI Continuously?
Monthly GEO ROI tracking requires three data points:
- Citation frequency delta (from alexandrya.ai dashboard): the change in citation frequency since program start
- Pipeline attributed to AI channel (from CRM survey): deals where buyers reported AI search as a first-touch
- Program cost (platform + labor): the total monthly investment
Divide (pipeline revenue attributed to AI channel × close rate) by program cost. This is your monthly GEO ROI estimate. Over 6–12 months, this ratio should trend upward as citation frequency compounds and the pipeline attribution becomes cleaner.
Build the Business Case for Your GEO Program
The data and framework are here. The question is what your numbers look like.
Start your free 7-day trial → Get your AI citation baseline and build your GEO business case
No credit card. Cancel anytime. First citation frequency report in minutes.
Frequently Asked Questions
What is a realistic first-year GEO ROI for a mid-market B2B company?+
For a mid-market B2B company with an ACV of €10,000–25,000, a realistic first-year GEO ROI is 8–25×, measured as incremental pipeline revenue attributable to AI citation improvement divided by GEO program cost. This assumes a 90-day ramp period and conservative citation frequency improvement of +15–20 percentage points.
How long does it take for GEO ROI to turn positive?+
For most B2B organizations, GEO ROI turns positive within 60–90 days, driven by citation frequency improvement on Perplexity and Google AI Overviews. The key variable is starting position: brands starting from zero AI visibility see faster ROI.
What is the minimum GEO investment for a positive ROI?+
The minimum viable GEO investment for positive ROI is approximately €400–800 per month (platform + 2–3 hours analyst time). At a conservative estimate of 2 additional closed deals per year at €10,000 ACV, the ROI is 2–4×. Positive, and growing as the program compounds.
Should GEO ROI be measured separately from SEO ROI?+
Yes, initially. GEO produces specific, trackable outputs (citation frequency, position, competitive share) independent of SEO metrics. After 6+ months, a combined attribution model recognizing that GEO and SEO improvements reinforce each other becomes appropriate.
Is GEO ROI different for enterprise versus SMB companies?+
Yes. Enterprise companies have higher ACVs, amplifying the revenue side but also more complex attribution. SMB companies have simpler attribution and faster sales cycles. Both segments see positive GEO ROI — the drivers and timelines differ.
Run Your First AI Visibility Scan
No credit card. No commitment. Just clarity on how ChatGPT, Gemini and Perplexity describe your brand today.

Talaal Max Habib
Managing Director at Alexandrya.AI
Alexandrya.AI is a GEO and AI visibility tracking platform based in Munich, Germany.
LinkedIn