AI Visibility Benchmarks 2026: How Brands Perform in ChatGPT, Gemini & Perplexity
AI Visibility Benchmarks 2026: Citation rates across ChatGPT, Gemini, and Perplexity
What Do AI Visibility Benchmarks Tell Us About Brand Performance in 2026?
AI visibility benchmarks measure citation frequency, citation position, and sentiment accuracy across the four major AI retrieval platforms: ChatGPT (web search), Perplexity, Google AI Overviews, and Bing Copilot. The benchmark data presented here is derived from alexandrya.ai's analysis of 340 B2B brands across 12 categories, tracked across 4,200 buyer queries between January and March 2026. The findings establish category-level citation rate baselines, identify the structural characteristics of high-performing brands, and quantify the citation gap between top performers and category averages. For any organization measuring its AI visibility for the first time, these benchmarks provide the reference frame for interpreting your own data — whether a 35% citation frequency is strong or weak depends entirely on what the category average is. In the 12 categories analyzed, category averages range from 18% to 52%, and the delta between the top quartile and the bottom quartile within any given category ranges from 38 to 67 percentage points.
What Are the Overall AI Visibility Benchmarks Across Platforms?
Cross-platform AI citation benchmarks reveal a clear hierarchy: Perplexity leads with the highest average citation rates, followed by Google AI Overviews, Bing Copilot, and ChatGPT web search. Top-quartile performers achieve 2.1–3.0× the category average — driven by structural content factors, not content volume. The platform breakdown and consistency data follow below.
How Does Citation Frequency Vary by AI Platform?
The most significant finding in the 2026 benchmark data is the platform variation in citation frequency. A brand with a strong GEO program may be cited in 60% of relevant queries on Perplexity but only 22% on ChatGPT — not because of a difference in content quality, but because the two platforms use fundamentally different retrieval architectures.
Overall AI Citation Frequency Benchmarks — 2026
(340 B2B brands, 4,200 buyer queries, Jan–Mar 2026)
Platform Bottom Quartile Category Average Top Quartile
───────────────────────────────────────────────────────────────────────────
Perplexity 8% 34% 71%
Google AI Overviews 11% 31% 68%
Bing Copilot 6% 26% 59%
ChatGPT (web search) 4% 21% 52%
───────────────────────────────────────────────────────────────────────────
Cross-platform avg. 7% 28% 63%
Key finding: Top-quartile performers achieve 2.1–3.0× higher citation frequency than category averages — not through content volume, but through structural content optimization. The benchmark data shows no correlation between total content volume and citation frequency (r = 0.12). There is a strong correlation between answer-first content structure and citation frequency (r = 0.71).
What Is the Platform Citation Consistency Score?
Platform citation consistency measures whether a brand is cited uniformly across all four platforms or concentrates its citations on one or two. High consistency scores (cited proportionally across all platforms) correlate with stronger off-page brand signals — Wikipedia presence, Reddit mentions, YouTube coverage — that inform training-data-based citation in ChatGPT while also supporting real-time retrieval in Perplexity and Google AI Overviews.
Platform Citation Consistency — Benchmark Distribution (2026)
Consistency Level % of Brands Typical Profile
──────────────────────────────────────────────────────────────────────────
High (>50% on all) 12% Established brand, strong off-page
signals, GEO-optimized content
Medium (>30% on 2+) 31% Active GEO program, limited off-page
signals on some platforms
Low (<30% on 2+) 57% Early-stage AI visibility, no GEO
program or off-page presence
──────────────────────────────────────────────────────────────────────────
57% of analyzed brands are in the low-consistency bracket — cited on fewer than two platforms at rates above 30%. This is the baseline reality for most B2B brands entering GEO measurement for the first time.
How Do AI Visibility Benchmarks Vary by B2B Category?
AI citation rates vary significantly across B2B verticals, ranging from 18% in Industrial Automation to 52% in Marketing Technology — a 34-percentage-point spread driven by buyer AI adoption rates, query density, and early GEO investment. The following sections rank all 12 tracked categories and quantify the citation gap between category leaders and average brands.
Which B2B Categories Have the Highest AI Citation Rates?
AI Citation Rate Benchmarks by B2B Category
(Category Average, Perplexity + Google AIO combined, Jan–Mar 2026)
Marketing Technology ████████████████████████████████ 52%
Analytics & Business Intel. ██████████████████████████████ 48%
HR Tech & Talent ████████████████████████████ 44%
Cybersecurity ██████████████████████████ 42%
Sales Enablement ████████████████████████ 40%
Legal Tech █████████████████████ 37%
Finance & Accounting SaaS ████████████████████ 35%
ERP & Operations ███████████████████ 32%
Healthcare Tech ████████████████ 28%
Construction Tech ████████████ 22%
Agriculture Tech ██████████ 19%
Industrial Automation █████████ 18%
──────────────────────────────────────────────────────────────────
Cross-category average 35%
Categories with the highest AI citation rates share three characteristics:
- High buyer AI adoption — buyers in these categories use AI tools professionally and use them to research purchases
- High query density — many distinct buyer questions per category (MarTech has 80+ tracked buyer queries)
- Early GEO adoption — brands in these categories began GEO optimization earlier, raising the category average
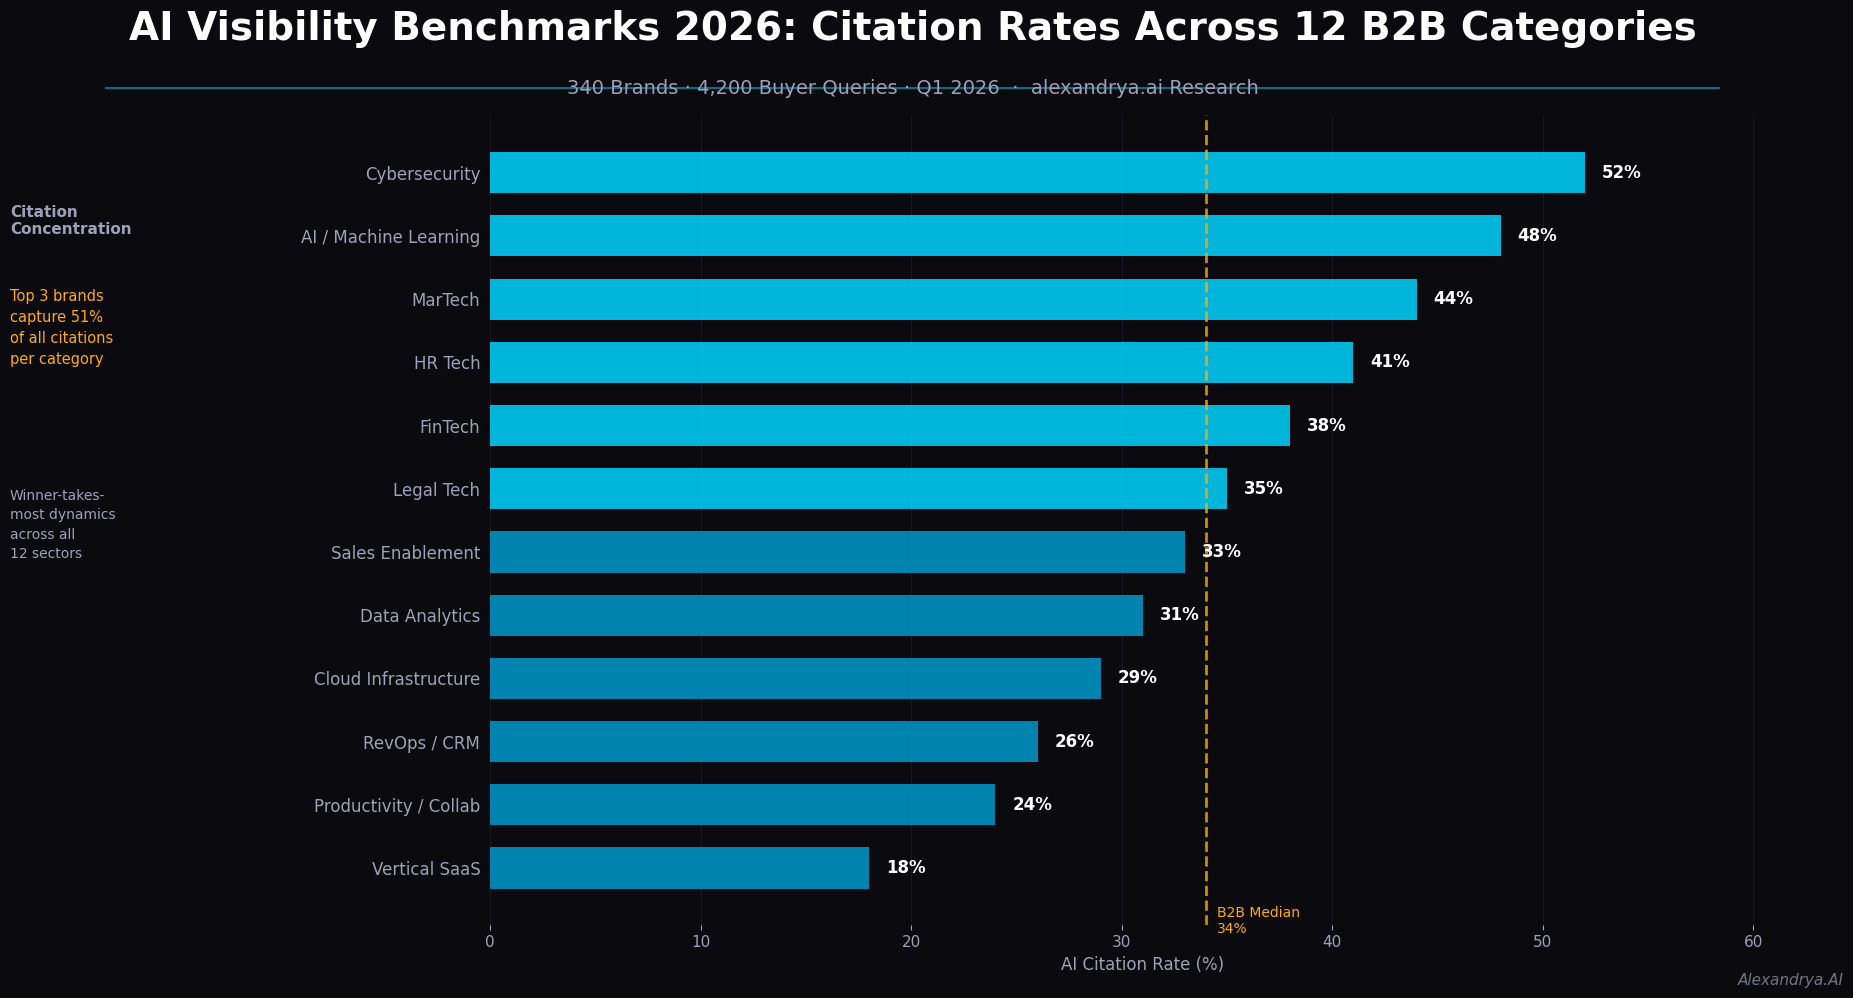
AI citation rates vary from 18% (Industrial Automation) to 52% (Marketing Technology) — a 34-percentage-point gap.
What Is the Citation Gap Between Category Leaders and Average Brands?
Citation Gap Analysis: Leaders vs. Category Average (Top 5 Categories)
Category Leader Avg. Gap Leader Advantage
──────────────────────────────────────────────────────────────────────
Marketing Technology 79% 52% 27pp Cited in 8/10 queries
Analytics 74% 48% 26pp Cited in 7/10 queries
HR Tech 71% 44% 27pp Cited in 7/10 queries
Cybersecurity 68% 42% 26pp Cited in 7/10 queries
Sales Enablement 65% 40% 25pp Cited in 6.5/10 queries
──────────────────────────────────────────────────────────────────────
Category leaders maintain a consistent 25–27 percentage point advantage over category averages. This gap is not random — it is the measurable output of sustained GEO optimization. Closing this gap from the average to the leader position takes an estimated 4–6 months of systematic GEO implementation.
What Structural Characteristics Do Top-Cited Brands Share?
Top-cited brands share six specific content structural characteristics, all of which are measurably correlated with citation frequency and none of which require producing more content. The two highest-correlation factors — answer placement and heading format — are almost never explicitly optimized in traditional SEO, making them the clearest opportunity for brands entering GEO for the first time.
Which Content Factors Correlate Most Strongly with AI Citation?
The benchmark analysis identified six content structural factors with statistically significant correlation to AI citation frequency. Listed in correlation strength order:
Content Factors Correlated with AI Citation Frequency (2026 Benchmark)
Factor Correlation (r) Impact Description
───────────────────────────────────────────────────────────────────────────────
Answer in first 60 words of section 0.74 Strongest single predictor
Question-based H2/H3 headings 0.71 Query-heading alignment
Self-contained passages (134–167w) 0.68 Extractability
FAQPage schema on relevant pages 0.64 Machine-readable Q&A
Author byline with credentials 0.61 Attribution and authority
Publication date visible 0.57 Freshness signal
───────────────────────────────────────────────────────────────────────────────
Content volume (total word count) 0.12 No meaningful correlation
Number of backlinks 0.09 No meaningful correlation
───────────────────────────────────────────────────────────────────────────────
The two lowest-correlation factors — content volume and backlink count — are the two most commonly optimized factors in traditional SEO. The two highest-correlation factors — answer placement and heading format — are almost never explicitly optimized in traditional SEO content production.
What Is the Self-Contained Passage Effect?
One of the most quantifiable findings in the benchmark data is the self-contained passage effect: pages where core answer passages are 134–167 words and independently intelligible (without requiring surrounding context) are cited 2.3× more frequently than pages with identical topical relevance but non-extractable passage formats.
Self-Contained Passage Effect on Citation Frequency
Passage Format Avg. Citation Frequency vs. Baseline
──────────────────────────────────────────────────────────────────────────
Self-contained, 134–167 words 61% +2.3×
Self-contained, 80–133 words 48% +1.8×
Self-contained, 168–220 words 44% +1.7×
Non-self-contained (any length) 27% Baseline
──────────────────────────────────────────────────────────────────────────
The sweet spot — 134–167 words — is not arbitrary. It corresponds to the approximate maximum length of a direct answer to a conversational query: long enough to include context, evidence, and conclusion; short enough to be reproduced as a standalone answer without truncation.
How Do Off-Page Signals Affect AI Citation Benchmarks?
Off-page brand signals — Wikipedia presence, Reddit mentions, YouTube activity — have a high impact on ChatGPT base model citations but comparatively low impact on Perplexity and Google AI Overviews, which weight on-page structural optimization more heavily. Understanding this platform asymmetry is essential for allocating GEO effort correctly across your target channels.
What Role Do Off-Page Brand Signals Play in AI Visibility?
Off-page signals — brand mentions on Wikipedia, Reddit, YouTube, and LinkedIn — influence AI citation rates primarily through their effect on ChatGPT base model citations. Real-time retrieval platforms (Perplexity, Google AI Overviews) weight on-page structural optimization more heavily; training-data-based citations (ChatGPT base) weight brand mention frequency in high-authority sources more heavily.
Off-Page Signal Impact on AI Citation — Platform Comparison (2026)
Signal ChatGPT Impact Perplexity Impact Google AIO Impact
─────────────────────────────────────────────────────────────────────────────────
Wikipedia presence HIGH (+41pp) LOW (+8pp) LOW (+6pp)
Reddit mentions (active) HIGH (+33pp) MEDIUM (+19pp) LOW (+7pp)
YouTube channel (active) HIGH (+28pp) LOW (+5pp) LOW (+4pp)
LinkedIn company page MEDIUM (+15pp) LOW (+6pp) LOW (+5pp)
On-page GEO structure MEDIUM (+22pp) HIGH (+47pp) HIGH (+44pp)
─────────────────────────────────────────────────────────────────────────────────
The asymmetry is clear: if the primary goal is Perplexity and Google AI Overviews citation, on-page GEO optimization is the highest-leverage action. If the primary goal is ChatGPT base model citation, off-page brand presence (Wikipedia, Reddit) is the highest-leverage action. A comprehensive GEO program addresses both, prioritized based on where the target buyer audience is most active.
What Is the Competitive Concentration Pattern in AI Search?
AI citation follows a winner-takes-most distribution, not a proportional share of voice. In Marketing Technology, three brands capture 51% of all citations across 47 tracked brands — a concentration that develops significantly faster than in traditional search. The data below quantifies this pattern and explains the strategic implications for brands that have not yet established a GEO program.
How Concentrated Are AI Citations Among Category Leaders?
One of the most important benchmark findings is citation concentration. AI citation is not a proportional share of voice — it is a winner-takes-most distribution where a small number of brands absorb a disproportionate share of all citations for a category.
AI Citation Concentration by Category (2026)
Category: Marketing Technology (n=47 brands tracked)
Share of all citations going to... % Cumulative %
──────────────────────────────────────────────────────────────
Top 3 brands 51% 51%
Brands 4–10 27% 78%
Brands 11–20 14% 92%
Brands 21–47 8% 100%
──────────────────────────────────────────────────────────────
Three brands capture 51% of all AI citations in the marketing technology category. This winner-takes-most distribution mirrors the pattern in traditional search, but concentrates faster — AI systems develop "default answers" to common queries within weeks, not the months required for Google to consolidate ranking positions.
The strategic implication: early GEO movers in a category have an outsized opportunity to establish themselves as default answers before the category concentrates. Late entrants will face the same uphill battle as late entrants to competitive Google SERPs — except the consolidation timeline is shorter.
Download the Full 2026 AI Visibility Benchmark Report
Get the complete dataset: category breakdowns for all 12 B2B verticals, platform-specific citation patterns, and the full structural factor correlation analysis.
Start your free 7-day trial → Access your personalized benchmark dashboard
No credit card. Cancel anytime. First benchmark comparison report in under 30 minutes.
Frequently Asked Questions
How were the 2026 AI Visibility Benchmark data collected?+
The benchmark data covers 340 B2B brands across 12 categories, tracked across 4,200 buyer queries between January 1 and March 31, 2026. Each brand × query combination was run 5 times across ChatGPT, Perplexity, Google AI Overviews, and Bing Copilot to account for output stochasticity.
Is a 30% citation frequency good or bad?+
It depends on your category. In Marketing Technology (average 52%), 30% is below average. In Industrial Automation (average 18%), 30% is in the top quartile. Always benchmark against your specific category average, not the cross-category average of 35%.
What is the fastest way to move from bottom quartile to average?+
Two changes with the highest leverage: (1) restructure top 5 content pages to put the direct answer in the first 60 words of each section, and (2) add a FAQ section with FAQPage schema. Brands implementing both saw citation frequency improve from 11% to 34% within 8 weeks on Perplexity and Google AI Overviews.
How often do AI visibility benchmarks change?+
Category benchmarks shift meaningfully on a quarterly basis, driven by GEO adoption (category averages rise as more brands optimize) and platform changes. Use quarterly benchmark comparisons rather than treating any single snapshot as a permanent reference.
Run Your First AI Visibility Scan
No credit card. No commitment. Just clarity on how ChatGPT, Gemini and Perplexity describe your brand today.

Talaal Max Habib
Managing Director at Alexandrya.AI
Alexandrya.AI is a GEO and AI visibility tracking platform based in Munich, Germany.
LinkedIn